For a UK industrial tool or machinery manufacturer, a qualified pipeline is a set of opportunities that each meet a written standard of evidence: the account is in market, the buying committee is identified, the stage is known, and the next technical action is defined. It should deliver fewer, better opportunities to engineering, a shorter cycle, and a board report in pounds and days rather than enquiry counts.
What does “qualified” actually mean?
Most manufacturers use the word without a definition. Ask the sales director and the marketing manager separately what makes an enquiry qualified and the answers will differ, which means every lead is sorted by instinct and the argument about lead quality never ends.
A usable definition has four parts, and an opportunity has to meet all of them before it counts:
- In-market evidence. The account is researching the product category: comparing specifications, requesting category information, or aligning internal stakeholders. An enquiry form or a badge scan is not evidence of this on its own.
- Committee mapped. The business knows who owns the requirement, who evaluates suppliers and who approves the spend, even if it has only spoken to one of them.
- Stage known. The opportunity sits in a named stage, such as evaluation, specification or procurement, with written criteria for entering and leaving it.
- Next action defined. Someone owns the next technical or commercial step, and the date by which it happens is recorded.
Buyer intent data supplies the first part. It is demand-side research signal, and it is not the same thing as shipment tracking or customs records, which describe goods already moving under a decision taken months earlier. The distinction is set out in buyer intent data versus shipment tracking.
Why does the definition matter more than the volume?
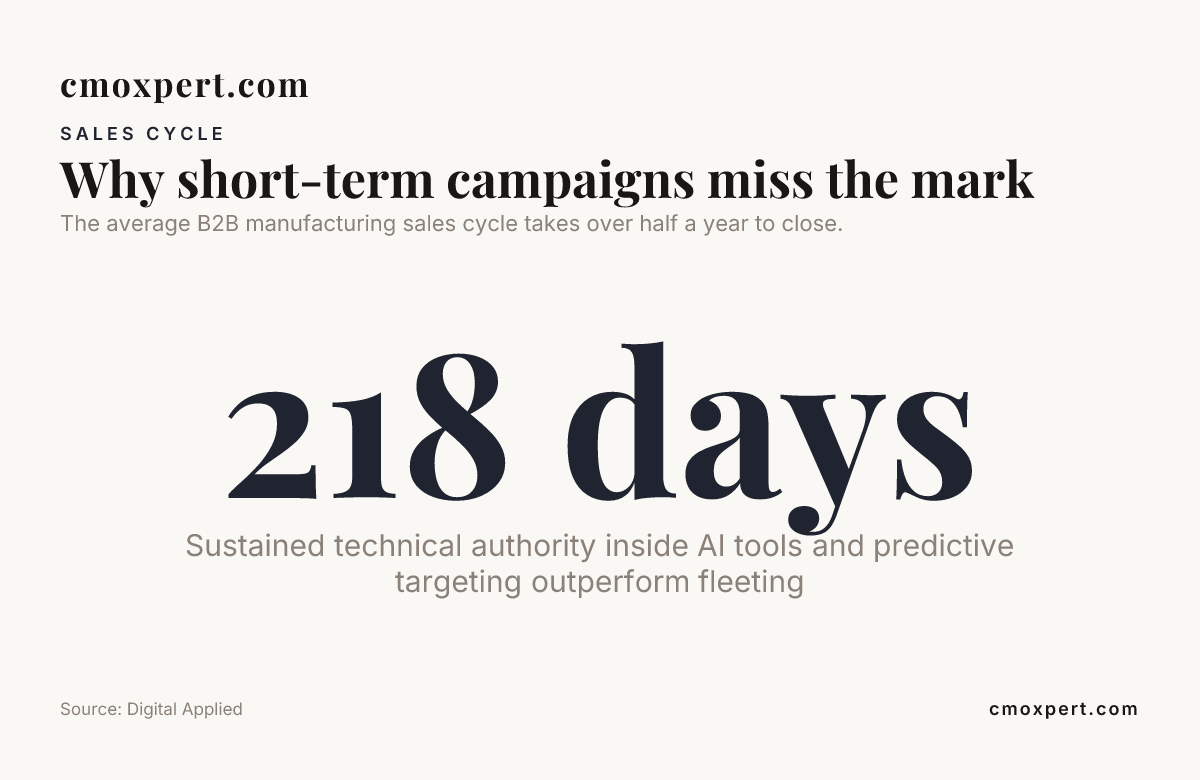
In a six-to-eighteen-month buying cycle, an unqualified enquiry costs more than it appears to. Applications engineering hours are spent on a drawing for an account that was never evaluating. A site visit is booked with a contact who cannot approve anything. The forecast carries the opportunity at full weight for two quarters before it quietly dies.
Volume makes this worse, not better. A pipeline that doubles in enquiries while the definition stays loose doubles the sorting work and leaves stage time where it was. The cash consequences of long stage time are set out in what a 12-month sales cycle costs a UK manufacturer in cash.
A written definition reverses this. Fewer opportunities reach engineering, each with a known stage and a next action, so technical time goes to accounts that can sign.
What should a qualified pipeline deliver?
| Deliverable | What it looks like in practice | Who it serves |
|---|---|---|
| A hand-over standard | Written criteria agreed by sales and marketing for what reaches the sales team, applied the same way every time | Sales director |
| Protected engineering time | Quotation and applications work only on opportunities that meet the standard | Engineering manager |
| Stage visibility | Every opportunity in a named stage, with days in stage recorded | Managing director |
| Follow-up latency | Days between a new signal and the next action, measured and reported | Sales and marketing |
| Board metrics | Stage time, conversion between stages, cost per qualified opportunity, cost per acquisition | Board and finance director |
| A forecast the board trusts | Win probability refreshed by evidence rather than carried forward by habit | Finance director |
Together the last two rows describe pipeline velocity: the rate at which qualified opportunities become signed revenue. That is the figure a board can act on, because it connects commercial spend to the management accounts.
What should a B2B marketing agency deliver for a UK manufacturer?
Most businesses searching for a marketing agency for manufacturers are trying to fix a pipeline problem, not a visibility problem. The usual agency answer is more activity: campaigns, impressions, event presence, a new brochure. None of that changes the definition of qualified, so none of it changes what reaches engineering.
The test to apply to any agency, including CMOxpert, is whether it will put four things in place that did not exist before:
- A written qualification standard that sales and marketing both sign.
- Continuous demand capture from buyer intent signals, not only from enquiry forms and exhibitions. How to compare providers is covered in how to compare intent data providers for UK industrial sectors.
- Routing rules that move an opportunity to technical follow-up when the evidence is present, with latency measured.
- A monthly board report on stage time, conversion, cost per qualified opportunity and cost per acquisition.
An agency that reports clicks, impressions or badge scans is reporting its own activity. An agency that reports pipeline velocity is reporting the client’s business. CMOxpert operates as the second kind, installing the commercial system rather than running campaigns inside a missing one. How the system is installed is described at how the autonomous pipeline system works.
Where do trade shows fit?
An exhibition stand records presence, not procurement readiness. The buying committee for capital equipment usually forms its requirement and a first shortlist before show season, so the stand meets buyers late and the scanned contacts need re-qualifying afterwards.
Inside a qualified pipeline, the show becomes an activation event: accounts already identified as in market are invited to the stand for technical validation, and every conversation goes back through the same stage-entry criteria as any other signal. The full argument is in why trade shows fail to capture intent before procurement starts.
Who is this built for?
CMOxpert works with a defined segment so that the qualification standard, the stage model and the board report can be installed rather than invented each time:
- UK industrial tool and machinery manufacturers, with European manufacturers equally welcome
- £10 million to £50 million annual revenue
- Six-to-eighteen-month sales cycles with multi-stakeholder buying committees
- A managing director who wants pipeline reported in pounds and days
As at September 2026 the published terms are a fixed-scope 30-day pipeline diagnosis sprint at £3,500, credited in full against the first retainer month if the engagement continues within 60 days, and a pipeline architecture retainer from £3,000 per month. A manufacturer outside this profile is usually better served by a general marketing agency.
How do you start?
Not with a proposal. Start with a written account of the current state: what “qualified” means today in practice, where signals are captured and where they die, how long opportunities sit in each stage, and what the board currently sees. That baseline is the first deliverable, and it is usually the first time sales and marketing have agreed a definition.
CMOxpert runs this as the pipeline diagnosis, with a board-style read-out of where high-margin buyers are being lost. The read-out is the evidence for whether to install the system, with CMOxpert or internally.
Frequently asked questions
What is a qualified pipeline in manufacturing?
A set of opportunities that each meet a written standard: the account is researching the category, the buying committee is mapped, the stage is named with entry criteria, and the next action has an owner and a date. Enquiry volume and badge scans do not qualify an opportunity on their own.
How is qualified pipeline different from lead generation?
Lead generation produces contacts and enquiries and is measured on volume. A qualified pipeline applies a written standard before anything reaches the sales team, and is measured on stage time, conversion between stages and cost per qualified opportunity. The first fills a spreadsheet. The second protects engineering time.
What should a B2B marketing agency for UK manufacturers report?
Pipeline velocity, meaning stage time, conversion between stages, cost per qualified opportunity and cost per acquisition. Impressions, clicks and website traffic describe the agency’s activity, not the client’s pipeline, and cannot be reconciled to the management accounts.
Does buyer intent data replace trade shows?
No. Intent data captures demand that forms months before a stand is booked, so it does the discovery work. A trade show then serves as technical validation for accounts already qualified. Each conversation at the stand goes back through the same stage-entry criteria as any other signal.
What does a pipeline diagnosis involve?
A fixed-scope, 30-day review of the current qualification standard, signal capture, stage time and board reporting, ending in a written read-out of where high-margin buyers are being lost. As at September 2026 it is priced at £3,500, credited against the first retainer month if the engagement continues within 60 days.
Related guides: How to Compare Intent Data Providers for UK Industrial Sectors: A 2026 Comparison · Tungsten Price Pressure and the UK Tooling Sector: Why Demand Visibility Is Now a Board Issue